TABLE OF CONTENTS
General Overview
With Studio, you would be able to:
- Script and customize your own survey
- Customize the look and feel of your survey
- Set up and customize the types of respondent outreach and sample size for your survey
- Create and manage different distribution channels to distribute your survey to the right target audience
 Navigating to Studio
To navigate to Studio from the main login page, select the 'hamburger' icon and select Studio from the dropdown list. Under the Studio page, you would be able to view any surveys you have created and/or made available for you to access.
Access a study by clicking on ‘Create a new survey’ from the main page or the Studio page from the main menu.
Alternatively, you may also click on an existing study to access its Studio page.
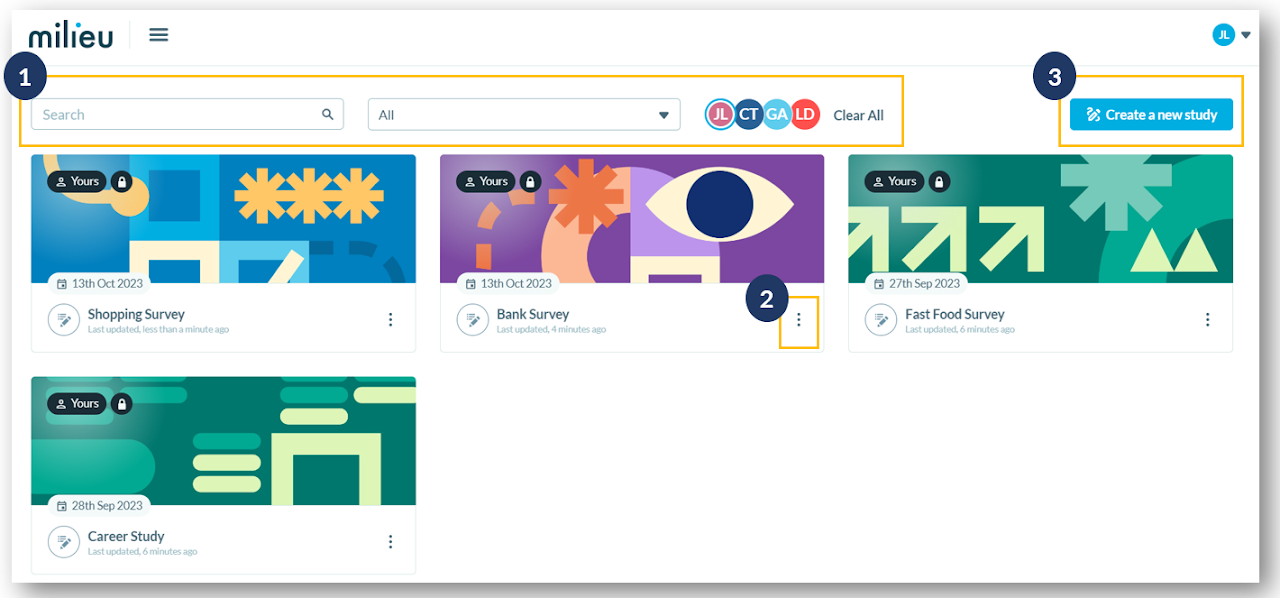
Finding your way around Studio's main page
On the main page of Studio:
- Search and filter for a specific survey through the search bar, status dropdown list and/or by users (i.e. creator of the survey).
- Edit and manage existing surveys.
- Create a new study by clicking the Create a new study button.
 Basic features in Build (the Visual Editor)
1. To access the Visual Editor view, please ensure you are in the Build tab.
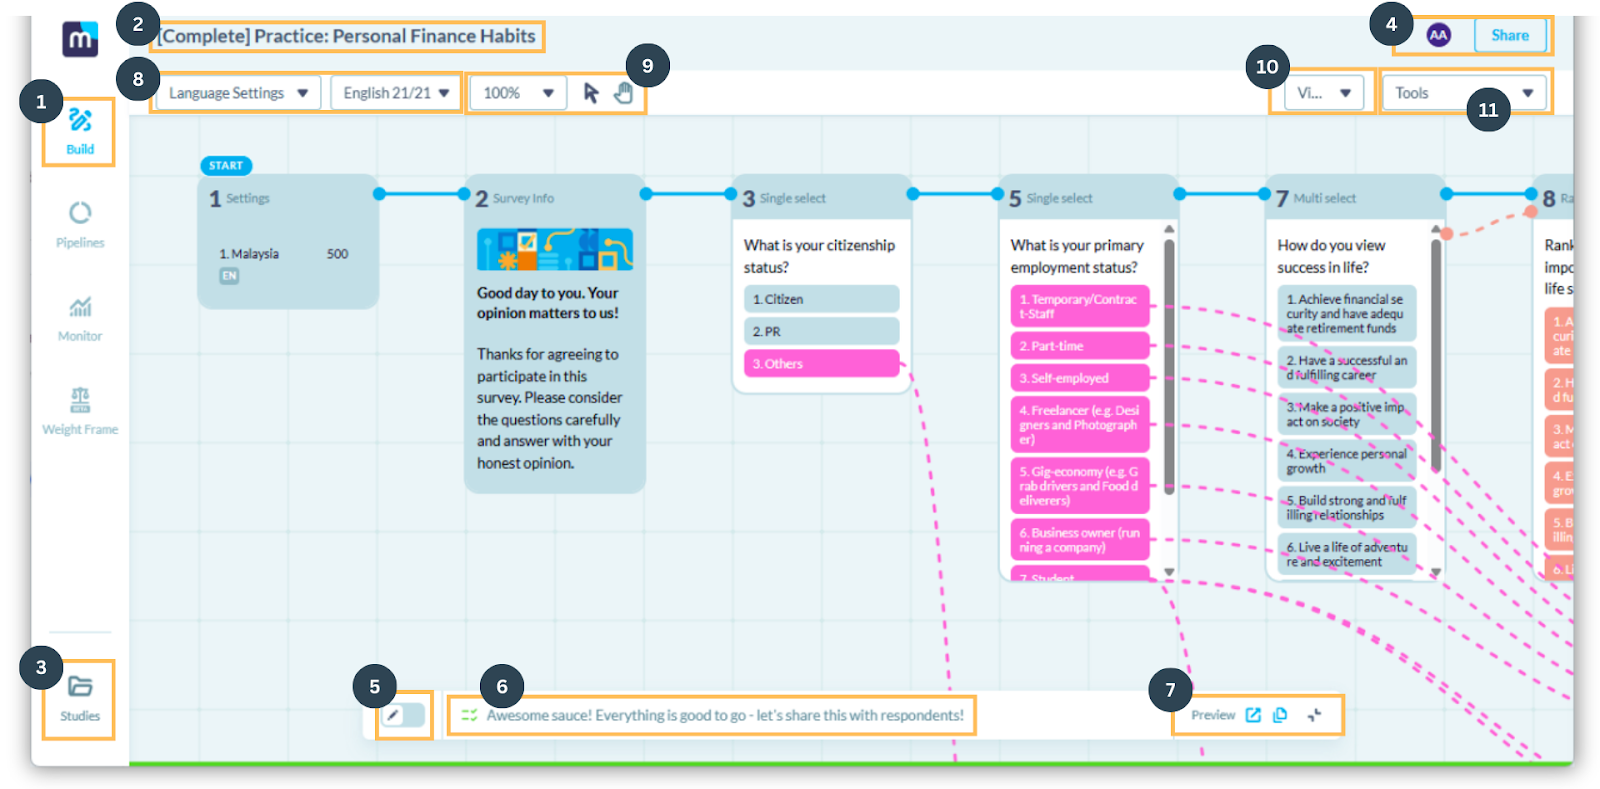
The Visual Editor covers a few basic features to familiarize yourself with:
2. Update the name of your study through the pencil icon next to the name of the survey.
3. Quick access to other studies from the Visual Editor without having to exit the survey completely.
4. Give access to the study to other users in your organisation via the Share button.
5. Edit Mode toggle: Then the toggle is off (pencil on the left), the study is in preview mode. When the pencil is toggled on (on the right), the study is in editing mode.
6. Dynamic info text: Find out more information about checks for errors/ actions when designing/ editing your survey. You can also save the study via the Save button before the study is ready for preview or publish.
7. Use the Study Preview (i.e. the pop-up and copy icons) to test out the survey through a web browser.
8. Manage language settings AFTER editing it in the Setting Card (First card in the Visual Editor). You can configure the languages for the survey to be available in and have an overview of the cards for translations.
9. (L-R) Zoom in and/ or out the zoom tool, click around with the mouse mode, move around the Visual Editor with the hand mode.
10. Visual Editor Connection view dropdown. Here, you can choose to hide some views such as routing connections (lines), piping connections or even question cards and/or logic cards. The default view is to show all.
11. Delete or Duplicate dropdown menu. You may select a card in Visual Editor and then either choose to delete or duplicate them here.
 Basic features in Pipeline
1. To access the Pipeline Monitoring view, navigate to the Pipeline tab on the left side panel in Studio.
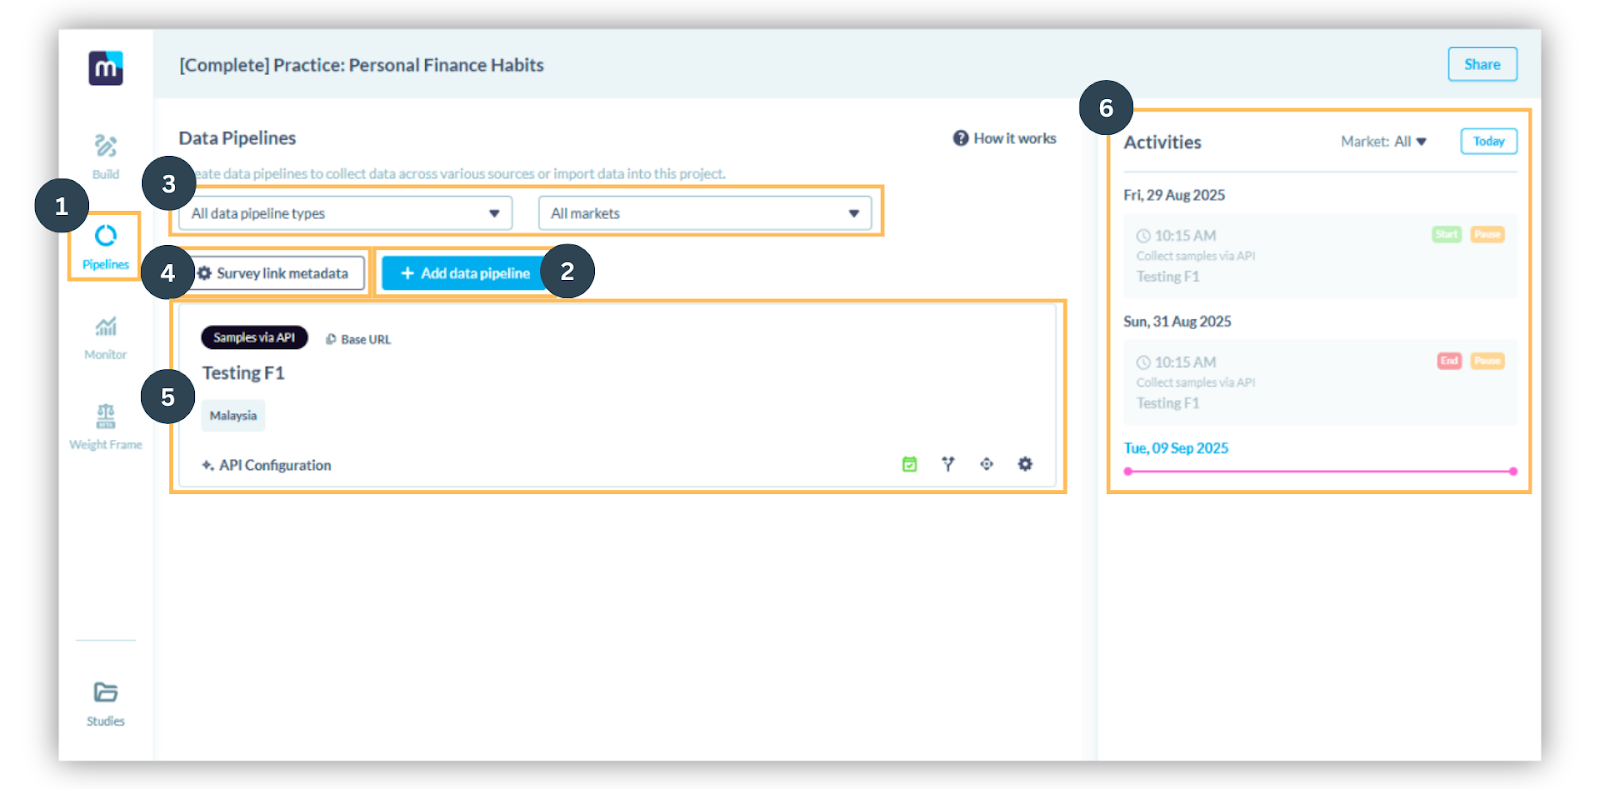
The pipeline tab serves as a way to launch the survey via different methods (pipeline) such as common link, unique links, or API.
2. The different pipelines can be created by clicking on the “Add data pipeline” button.
3. The page view can be filtered through the dropdown menu between the descriptions and the menu buttons.
4. You may edit how the link is viewed in social media sharing via the “Survey link metadata” button.
5. The basic details of each pipeline is displayed underneath the main buttons. Here, you may see which distribution pipeline it is using, the name of the pipeline, the market it is shared to and other mini icons indicating the schedule, redirect, integration and settings respectively.
6. Activities regarding the pipelines are displayed on the right column of the screen. You may check when it was launched and other scheduling here.
 Basic features in Monitor
To access the Monitoring view, navigate to the Monitor tab on the left side panel in Studio.
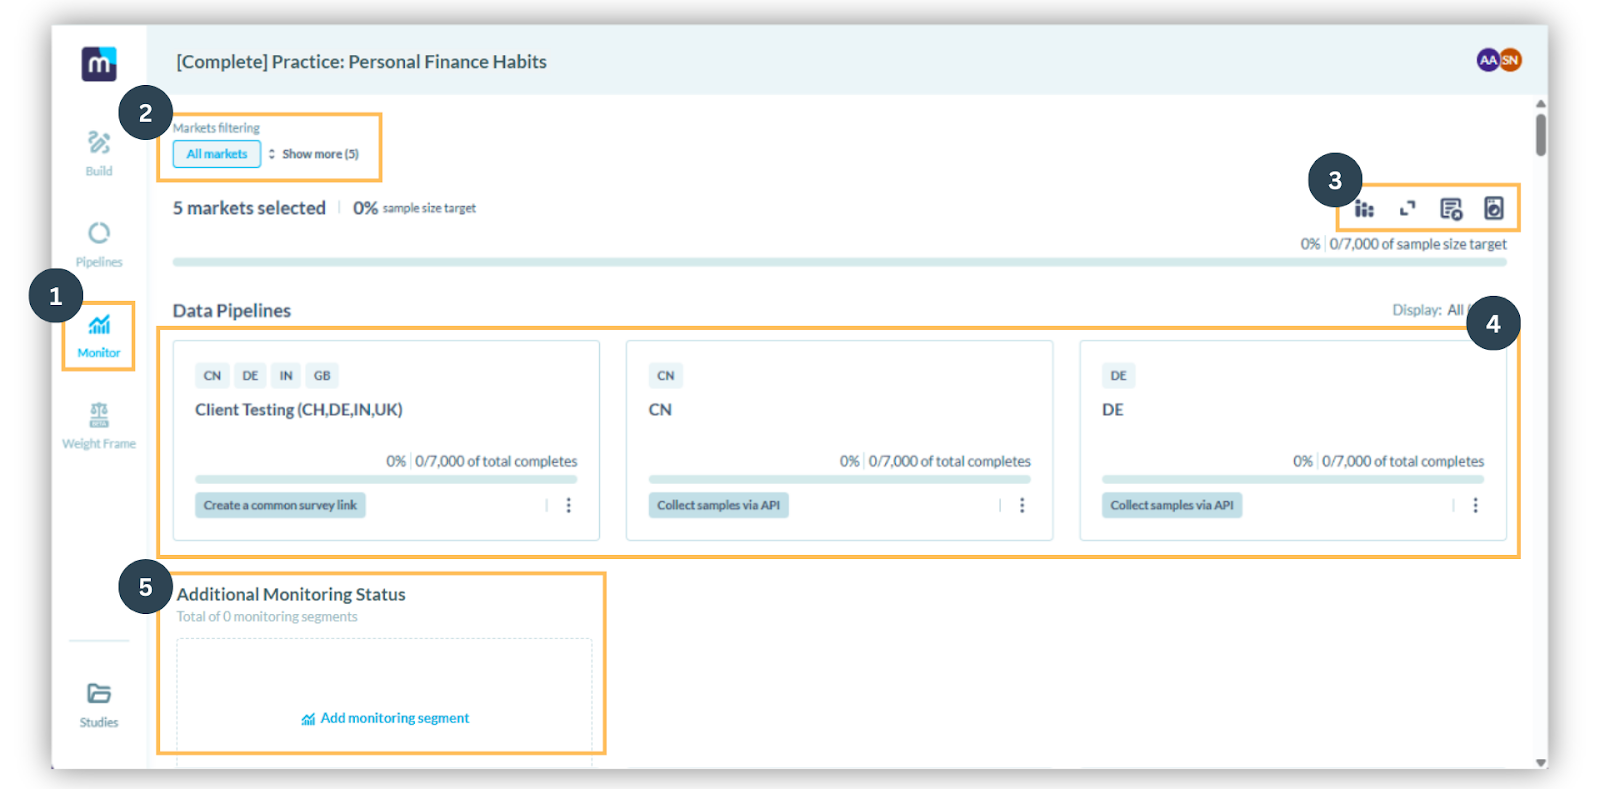
The monitor tab serves as a way to observe fieldwork as it is ongoing.
Features includes:
2. Filters by market: Have topline visibility of all the markets that your survey is running in.
3. Viewing options for data insights. These views allow for real-time insights, view breakdown, data export, and option to include or exclude specific collected response in the Monitor page.
4. Details of data collection can be observed based on pipelines created.
- For example, the first card shows a pipeline name "Client Testing..." where the markets for them are China, Germany, Indonesia and the United Kingdom. It was created via common survey link. We can also quickly see that we had a 7,000 respondent limit and 0 has been achieved so far.
5. Additional Monitoring Segments. This section provides additional customisation to fieldwork monitoring and enables users to create custom criteria to monitor specific segment groups.
 Basic features in Weight Frame
1. To access the Weight Frame view, please ensure you have exited the EDIT Mode in Studio, and are in the Weight Frame tab.
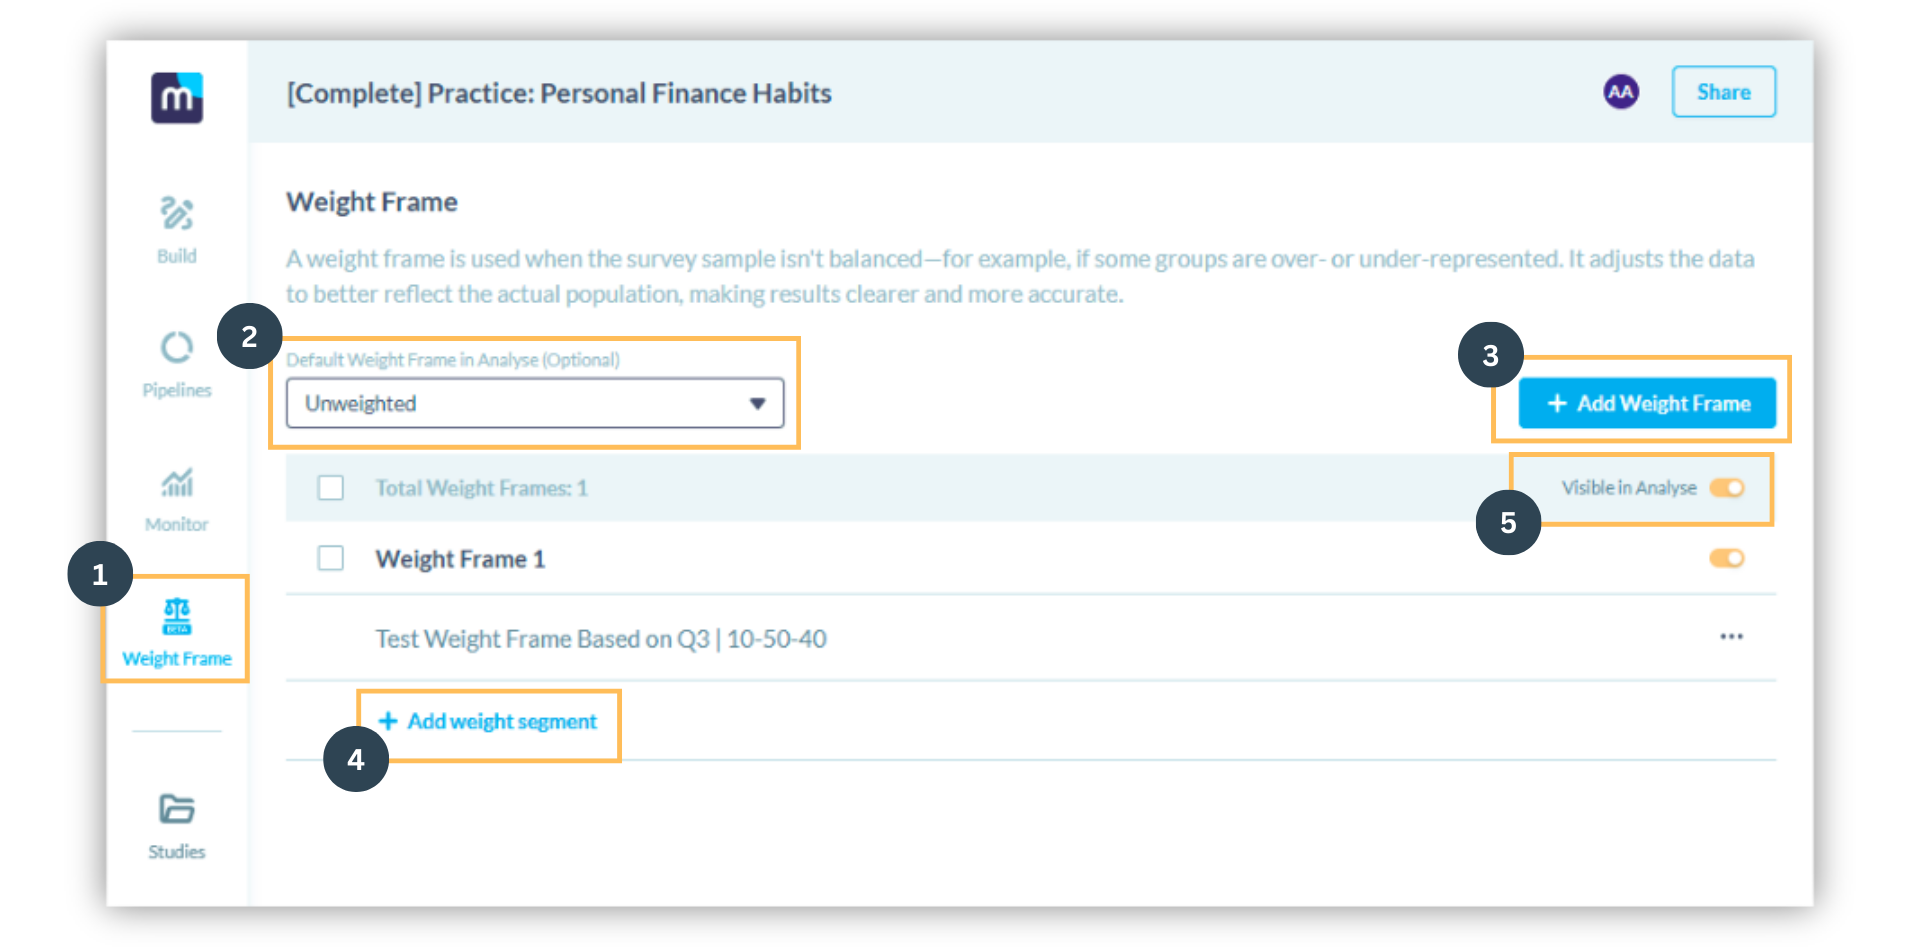
The Weight Frame tab functions as an additional edit, allowing users to choose and customise the weight frame used in reporting the data. This tab features:
2. Configure your dataset’s default when it comes to the application of weighting.
3. Add Weight Frame Button. Create and configure new weight frames to apply to your dataset.
4. Have the ability to further configure your weight frame.
5. Customise which weight frames can be visible for use in Analyse.
Was this article helpful?
That’s Great!
Thank you for your feedback
Sorry! We couldn't be helpful
Thank you for your feedback
Feedback sent
We appreciate your effort and will try to fix the article